Madison’s Budget Challenge, Part 2: Augustine’s 16th Law and future budgets, or Clickbait: How F-35s and the Madison Police Department share the same doom
The second entry in a four-part series, this post looks at what happens to the City of Madison’s structural budget deficit over the next 35 years if we don’t do anything.
Norman Augustine was undersecretary of the Army in the Gerald Ford administration, and later CEO of Lockheed-Martin. An engineer by training, in the early 1980s he published a set of “laws” (often tongue-in-cheek) he had discovered over the years. The most famous is the 16th Law, apparently derived from when he plotted out the unit costs of military airplanes starting back in the 1910s, and extended the line out into the future. Then he plotted out the growth of the US Defense budget, and proclaimed this:
In the year 2054, the entire defense budget will purchase just one tactical aircraft. This aircraft will have to be shared by the Air Force and Navy 3½ days each per week except for leap year, when it will be made available to the Marines for the extra day.
In an interview with the Economist Magazine 30 years later, Augustine said “we are right on target. Unfortunately nothing has changed.” And apparently not:
(though this post is not about to argue about the projected costs of the NGAD and the F/A-XX)
Earlier this spring, as the community conversation around the City budget got underway, a thought came to me: what did the budget picture look like in the 2030s and beyond? I knew Augustine’s “Law” and I wondered, are we similarly doomed?
Answering that question was the original motivation for what turned into this entire series of posts. I dug into the budget numbers and put together a model of how city revenues and expenditures might grow, and simulated things out for 35 years. The results are scary. In 2037, the structural deficit exceeds the cost of the entire police department. And, in what I assure you was pure coincidence, my model says that starting in 2054, the Madison structural deficit exceeds 50% of total general fund expenditures. Augustine’s Law strikes again.
But this is where we leave the fighter jets behind. This post is only about the Madison budget. For those of you who were hoping for a post about F-35 noise, police reform, or maybe a wild story about how the police department was getting surplus military jets, I’m sorry to disappoint you. The opportunity to connect F-35s and the police budget was just too Madison clickbait for me to resist.
For the second entry of my four part series, please stow your personal items, fasten your seatbelt, and prepare for take off into the wild blue yonder of budget numbers.
It’s not just 2025
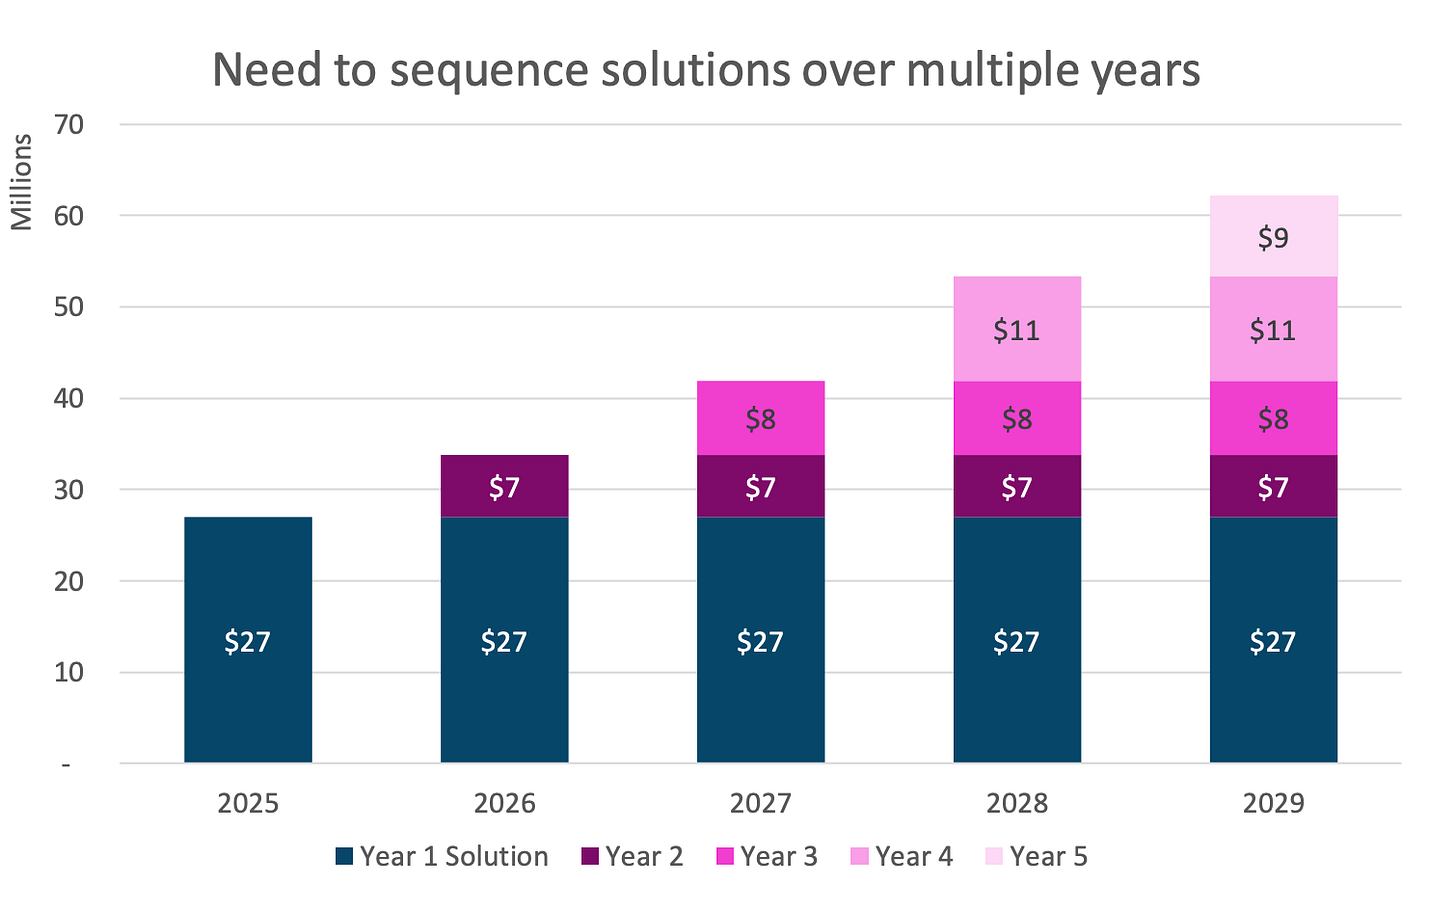
Most of the headlines on the budget have focused on the $27M gap in the 2025 budget, but the challenge we’re facing continues into the future. Here’s the graphic from the Wisconsin Policy Forum’s report for future year projections:
The graphic shows that we get up to over $60M in 2029. To be a bit more precise, we’d only get to $60M in 2029 if we were to not solve any of the previous years gaps, that is, if we were to solve the $27M gap for 2025 using one-time money, we’d have a $34M gap in 2026, because we’d have to solve the 2025 gap again and then solve a new $7M gap as well. If we solve the $27M gap with a revenue solution that would continue on into 2026, then we only have to solve a $7M gap in 2026. Here’s how the Finance staff estimates the next 5 years will go:
Looking at that you might have the same question I did: what would change in 2029 that would mean 2030 wouldn’t also have a gap? And the answer is nothing, we’re going to have a gap in 2030 as well. So what does that look like?
In order to answer that, we need to make our own model of the city budget.
Creating a model: “All models are wrong but some models are useful”
In this section I’ll briefly explain what I did to create the model - the data I used and the assumptions my model makes. If you don’t care about the details you can skip over this next section. If you want even more details, the Excel sheets I put together and the Python code for my model are available on Github.
The data: expenditure and revenue baselines
I went through the 2024 agency operating budget documents, and for each general fund agency, I copied out its total budget and general fund portion of its budget, and then the line items for salaries, benefits, supplies, and purchased services. For benefits, I further broke that down into health insurance and “other benefits.” For each agency, I also copied out the total number of full-time employees.
From that, I made a couple of adjustments. First I removed a few one-time expenses, like the grant funding the clerk got to buy new election machines. More importantly, I tried to adjust the line items to better match what is funded from the general fund vs other funding. This is captured at the “service” level but unfortunately is not in the budget at the individual line-item level. To estimate it, I take the overall budget by the general fund portion of the budget and then scale each department’s line items and staff numbers by that ratio. So for agencies like the Assessor’s office, which is 100% funded by the general fund, the ratio is 100% and the scaling changes nothing. For other agencies like Streets, which gets about 11% of its funding from the Stormwater utility, I scaled down its numbers by 11% - so for my model, the baseline number of staff is 219 instead of the 245 authorized in the budget. (Streets is actually an oddball case because of the funding from the recycling and urban forestry fees)
For revenue, I used the funding summary document but removed the one-time funding items that we are using in 2024 - the federal COVID money, the use of reserves funding, etc. This way the baseline already starts with the $18M gap. I mostly summarize the funding, but I break out the room tax and investment income so I can adjust those numbers separately.
The model isn’t rocket science. To make a projection for a year, the model just takes the previous year’s expenditures and revenues and multiplies them by some scale factor, and notes the differences. Those scale factors are a set of assumptions about how the future will unfold. I use mostly the same assumptions that City finance staff uses, which were detailed on slide 12 from this presentation by City finance staff: https://www.cityofmadison.com/finance/documents/budget/2025/Part2Powerpoint.pdf
The most important point is that we assume wages and benefits grow each year, and that the overall citywide headcount also grows, using numbers based on historic averages.
For revenue, most of my revenue assumptions match the Finance staff’s assumptions, though I model interest rate growth from our investments a bit different than how they do it, and I assume that revenue from hotel room tax grows faster than they assume it will.
My model leaves out debt service. For the most part this is OK, because the debt service expenditures are automatically matched by increases in property taxes to cover the debt, so it should cancel out. There are, however, some subtleties in debt service that can help the general fund but my model does not try to capture those, because I do not want to try to model the capital improvement plan.
Overall, my model is I think a bit more conservative than the model the Finance staff has created because they’re better at this than I am but they also have more accurate breakdown of fund sources, but my model should be reasonably close. You can find more details of how my model works in the source code for the model.
Model projections
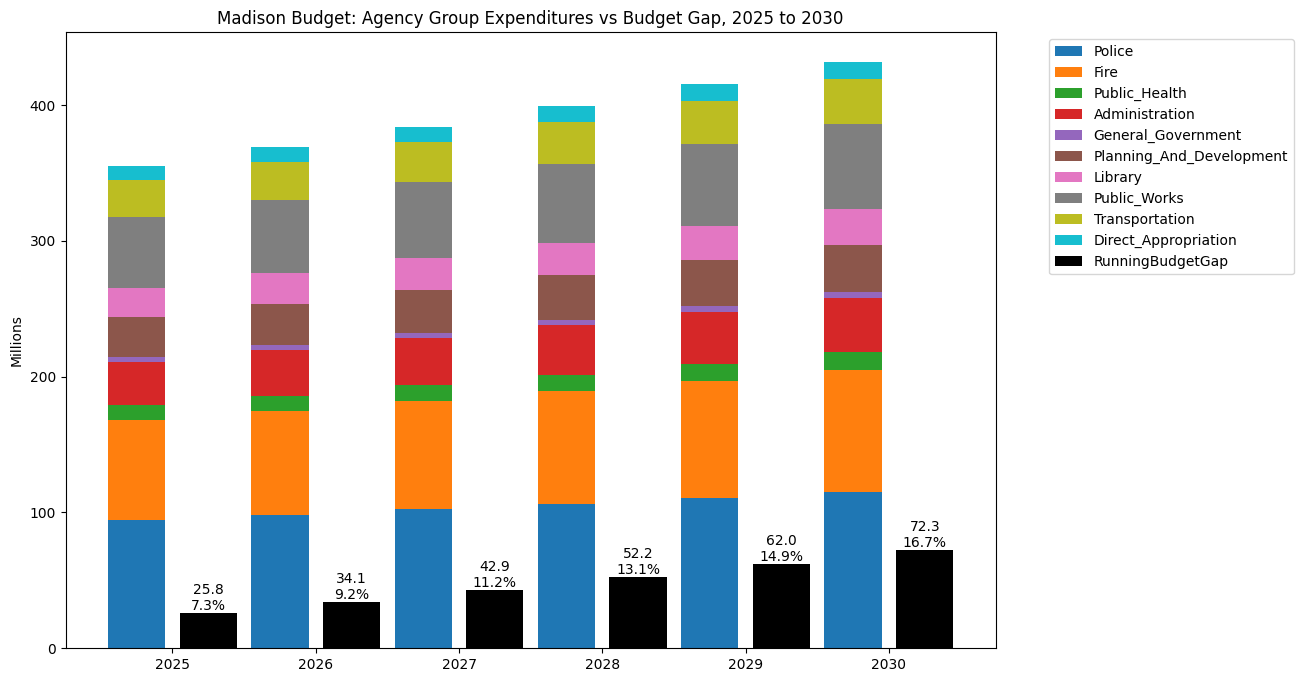
Indeed, my model is pretty close to the city’s model for the first 5 years. And to answer the question, what happens in 2030, well, the budget gap gets bigger (sorry these are hard to read on mobile)
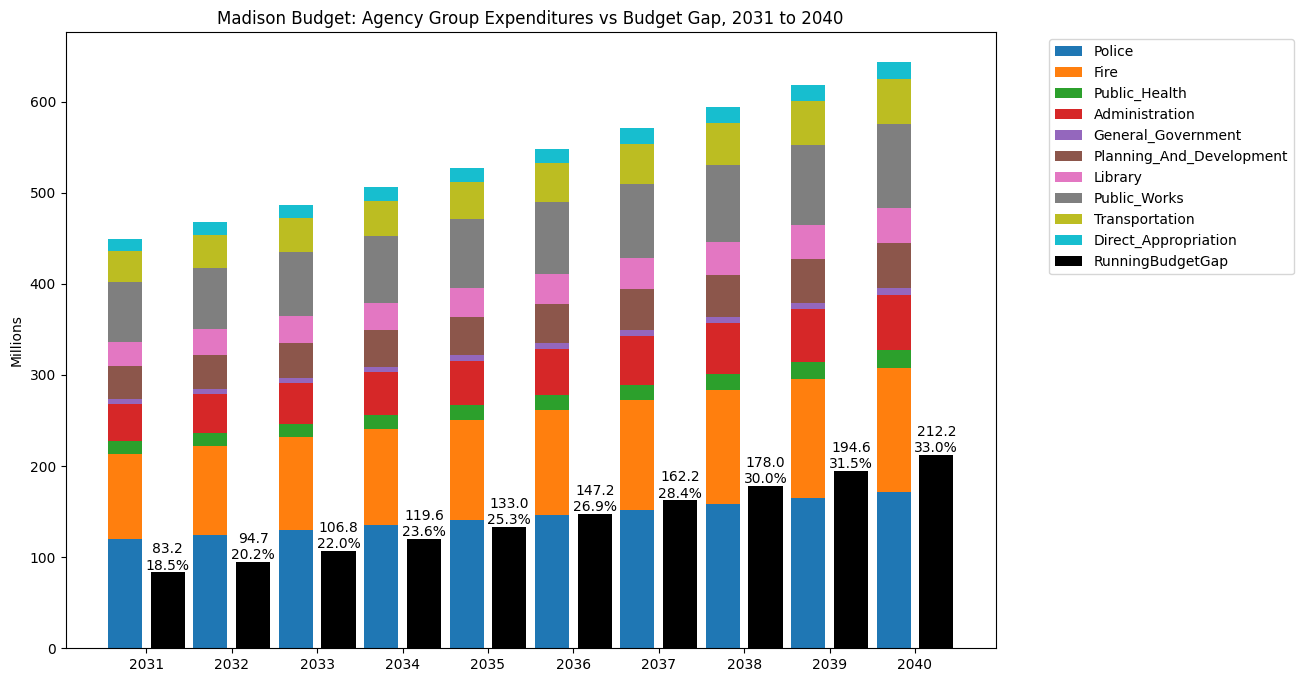
But since we’ve got the model, let’s project forward a few more years. Here’s the 2030s.
Well that’s getting rough. Notice in the year 2037 the budget gap exceeds the entire size of the police department (which is already much bigger - the model projects the police department budget in 2037 is $152M, compared to $91M in 2024.) By 2040, the budget gap is one third of the entire general fund operating budget.
Here’s the 2040s. It doesn’t look much better:
And here are the 2050s:
In 2054, the budget gap crosses the 50% mark of the general fund. At that point we can only afford police, fire, and some of public health - or we can afford everything but police, fire, and parts of public health.
Here are the full numbers. There are like 40 columns so you might need to scroll over.
One of the big drivers: health care
So, this post isn’t a full analysis of the budget and the drivers behind the budget gap. At its core, as we covered in part 1, the main problem is that our primary revenue source (property tax) is so heavily constrained that it does not adjust for any cost-to-continue expenses. The way the system works in Wisconsin is that a city can pay for a new cop, but not give raises to any of its existing cops - or raises to snowplow drivers, or cover the increased costs of fuel or any of the other expenses that go up each year. It’s a totally stupid system and the Wisconsin Legislature ought to be embarrassed to have kept it in place.
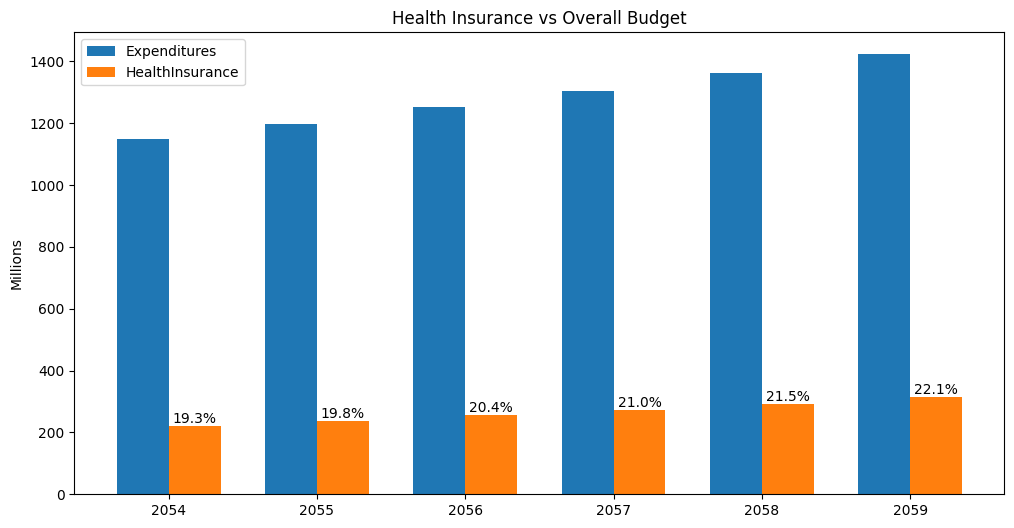
There is one driver of costs that I wanted to call out, which is another systemic funding failure of our society. Health care costs are the fastest-growing expense in Madison’s budget and hence in the model. Health care will account for 7.9% of the overall operating budget in 2025, and that grows to 9.6% in 2030.
Importantly, health care increases are a huge part of each year’s budget growth. Here’s the cost to continue growth of each year, compared to the increase in health insurance for that year. Notice that health care cost growth was 14.4% of the 2025 growth, and is 17.2% of the growth in 2030.
We can skip over the 2030s and 2040s, so let’s just jump right to the 2050s and look again. In the 2050s, health care costs are basically 20% of Madison’s entire budget, and make up about a third of each year’s increase.
Health care funding in this country needs to be dramatically rethought, and something more sensible would be very helpful for Madison’s budget in the future.
Taking the budget model to the casino
One of the shortcomings of the model is that it makes one set of assumptions for what happens each year and uses those assumptions for every year between 2025 and 2059. Obviously every year will not be the same - some years will be in a recession, other years will be boom years, some years will just be average. The assumptions of the City’s model and the model I used above were that every year is an average year, and over time all the assumptions “even out” and so we can just use the same figures.
An alternative to having a fixed set of assumptions is to try to account for what happens if, based on some probability, some years we have a recession, and some years are booms, and so on. Rather than using a fixed set of growth figures for each year, you “roll the dice” before each year to see what kind of year you’ll have and use that for your simulation.
I wrote a second version of the model that tries to account for this. Rather than using fixed assumptions, it sometimes decides that we’ll have a recession, or a boom year, or a year with high inflation. In a recession, the model adjusts the amount of new construction happening down, which limits how much new property tax we collect, and it assumes that because the state budget will also take a hit, the amount of state aid grows slower. But in a recession it also assumes that staff wages grow slower and interest rates go down. Similarly, in a boom year, the model assumes that net new construction goes up and state aid goes up and inflation and interest rates stay normal. In a high inflation year, the model cuts back on net new construction but increases state aid, increases wages, and cuts interest rates.
We call these types of simulations “Monte Carlo” simulations, because each time you run the simulation it’s like playing a game of chance. When you have these sorts of simulations that depend on throwing virtual dice in the computer, you can’t just run the simulation once and use those numbers, because you don’t know if you just had good luck or bad luck in that particular try of the simulation. You need to run the simulation over and over again and see how it goes over time.
I ran my simulation 10,000 times, each time through calculating new budget gaps for every year between 2025 and 2059. Then I arranged them, best to worst, and 500th best, the 5000th best (the median, where half of all simulations were better and half were worse) and the 9500th best and compared them and this is what I got:
The 500th best outcome was a budget gap in 2059 of $723 million - that’s what happens if Madison gets really lucky. The 9500th best - if we get really unlucky between now and 2059 - was a budget gap of $1.28 billion with a b. The median outcome, if things just kind of go OK, was $921 million.
Just to be upfront, I built this version of the simulation without spending a lot of time doing research. The numbers I used for what happens if things are “good” or “bad” I basically just pulled out of the air, and the probabilities of having a recession or a boom year are also just what I picked on vibes. This is all a polite way of saying my Monte Carlo simulations are probably total bullshit. If you and I were having a beer, I would feel comfortable defending my model. If you were an economics professor, I would probably try to sneak out of the room.
Wrapping up - is this all a little bit silly?
OK, thinking about the 2059 budget gap in 2024 is very silly. For one thing, by law the Common Council can’t just ignore the budget gap in 2025 and the budget will have to be balanced for the year, and then again in 2026. It seems unlikely that every year for the next 35 years each Council will find a set of one-time funds to kick the can to the next year, 35 times in a row, so the budget gap is not likely to be pushing $1B in 2059 -something will have been done.
We also know that a few years can make a big difference. Here’s the budget outlook for 2016, created just a few months after Mayor Soglin was sworn in for his last term:
It projected a $2.8M gap in 2019, and a $1.8M gap in 2020. In reality, there was a $4.7M gap in 2019, and Mayor Satya inherited a $10.8M gap when putting together her first budget.
So things change. Revenue or construction does better than we expect, state aid finally catches up, the Council and the Mayor have new priorities. I am going to have a good laugh at some of these numbers in 2040.
Making these sorts of far out projections reminds me of the AT&T ‘You Will’ ad campaign from 1993. It got a lot of things very wrong: “Have you ever…sent some a fax, from the beach? You will” or “Have you ever…made a video call, from a phone booth? You will”.
You watch the ads and you think “I can’t believe they thought that’s how it would work” as you watch the guy swipe his credit card in a payment machine built into the car to pay the EZ-Pass open road tolling. But, directionally, the ad got everything right: streaming movies, video calls, virtual learning, electronic medical records, ebooks. Sure, the details are all goofy, but the core of those ideas are right.
And so that’s what I want you to take away from my simulations. Will Madison have a $1B budget gap in 2059? Who knows. But, have you ever had a municipal financing system that wasn’t just a property tax levy that was indexed to increase at far less than cost to continue? You will.
Tomorrow in the next post in the series, we’ll dig into why the projected $31M surplus from 2023 is actually bad news.
I’m supporting Regina Vidaver for Dane County Executive and you should too! She’s a public health expert and has done big things on the Madison Common Council - CARES mental health response, the Building Energy Savings plan (which is a huge deal!) and Transportation Demand Management, among others. When I was on the Council with her she asked the best questions that always got at the heart of the issue, and I know she’ll be an excellent leader for Dane County!


